
Graph of the Month
September 2, 2018
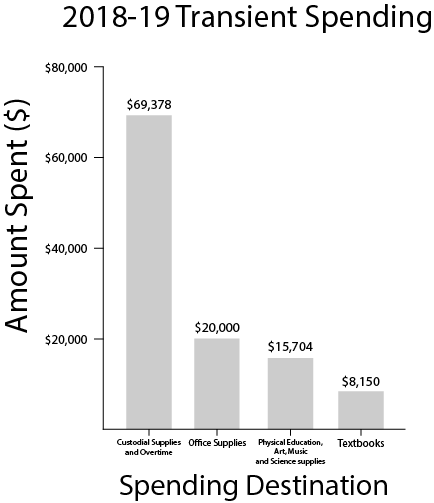
With the all the tumult of the new school year, we can imagine why you might’ve doubted our ability to produce another enlightening explanation of a sliver of Wilson’s abundance of statistics. But we never disappoint. This month, we decided to take a look at the distribution of non-personnel spending, money that goes towards supplies as opposed to salaries. There’s a daily litany of complaints about the lack of resources: bathrooms missing soap and toilet paper, printers out of paper and ink, ceramics classes short on clay.
The origin of these deficits confounds, unless you go into the bathroom at any point earlier than 11:00 pm. Wilson’s bathrooms require an exorbitant amount of attention. And that attention costs a lot of money: $69,378 this year, to be exact. This is more than quadruple what’s allotted for physical education, art, music, and science supplies combined, and triple what’s allotted for office supplies, which in this case encompasses any office materials in the classroom that a teacher did not pay for out of pocket.
So how do we redistribute the wealth so that all art classes have paint and all science classes have working Expo markers? At the end of the day, all it comes down to is taking better care of our school. There has already been $37,703 in overtime payment set aside for the custodial staff. This is money that could make a tangible contribution to our school community, instead of funding the extra hours it takes to fish chicken bones out of a toilet, or replace the brand new industrial sized roll of toilet paper that somehow found itself in a urinal.
This contribution could be to the other three destinations on the graph. New textbooks to replace the graffiti-ridden, dilapidated volumes that we use for our notes. A stapler that works in every classroom, and your teacher getting to keep the money they earn instead of spending it on supplies that the school can’t afford. And finally, art, music, PE and science departments that can keep up.