
Graph of the Month
October 5, 2018
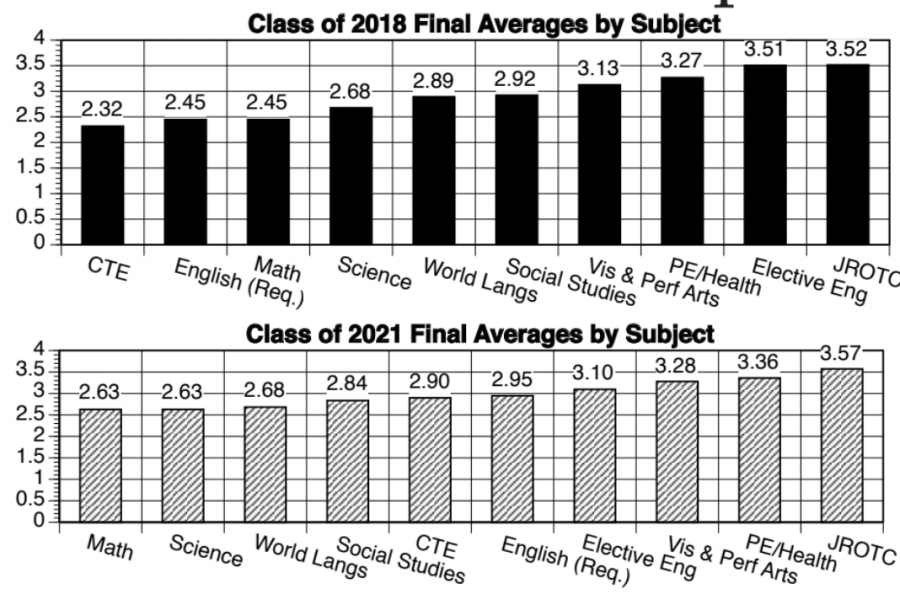
Damn, data coordinator. Back at it again with the graph analysis. This month, we’re looking at the average grade point averages (GPAs) across subjects. Here are our thoughts.
The general consensus, at least in our experience, has been that math is both the most difficult subject to teach and the most difficult subject to learn. For the most part the data supports this, as math has an extremely low average and other STEM classes at a near low. The only year where math doesn’t rank the absolute lowest is senior year. This could be attributed to the fact that there is a large group of students that have fulfilled their math credit requirements by senior year, and are therefore taking the class by choice, indicating an affinity for the subject. Another interesting point of note is that the World Languages climbs both in actual GPA and ranking from the class of 2021 to the class of 2018. This is likely because of the same reason: those who are taking a language senior year are not doing so because they have to, they are doing so because they enjoy it and are good at it.
For required English classes the opposite trend is true. The ranking among subjects decreases as the year in school increases. This shows that when English classes get more difficult, students at large aren’t as easily able to keep up.
English moves down in the rankings, and the average GPA itself also decreases from 2.95 for the class of 2021 to 2.45 for the class of 2018. The same direction change is true for math and science. We could potentially attribute this to the fact that most seniors know whether or not they’ll be graduating and whether or not they’ll be going to college about halfway through the academic year. This provides some incentive to slack off senior year, a little thing we call senioritis.
We want to emphasize that though we have lots of strong ideas about data, all our ideas are more theoretical than concrete. This particular analysis would be stronger had we looked at data from all four years of the class of 2018, or compared the freshman year averages across all four classes. Regardless, we enjoy sharing out musings about Wilson statistics with our dedicated readership. As always, contact us at beaconchiefeditor@gmail.com with your insights or questions.